“Just discovered an incredible indicator that could be a game-changer for spotting market trends—especially when using multiple time frames!
The video calls it ‘One Indicator To Rule Them All’ (yes, like Lord of the Rings!), and honestly, it lives up to the hype. Check it out—this might be your new secret weapon!”**

Here is a summary of the video:
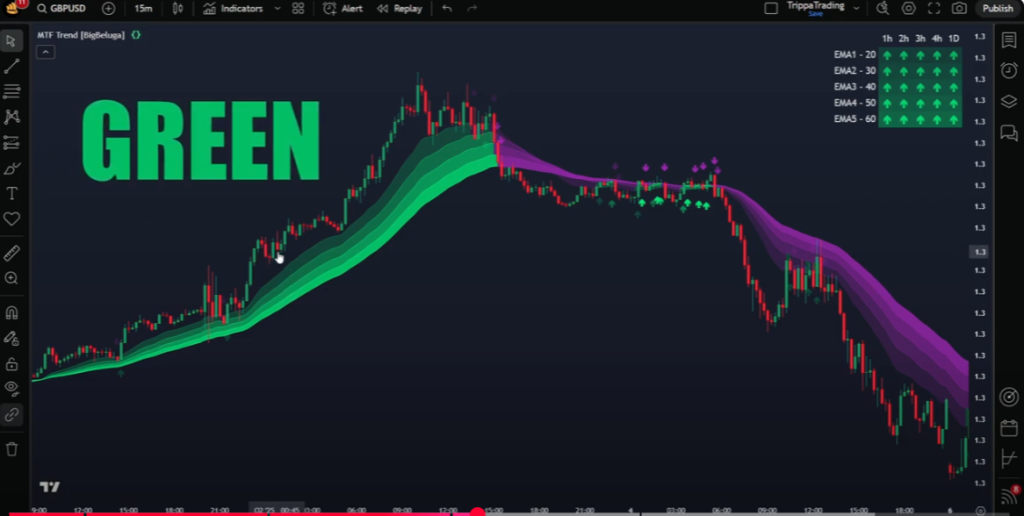
– 🔍 The video explains the use of a unique TradingView indicator called multi-time frame trend analysis, which stacks multiple EMAs across different time frames to reveal overall market trends.
– 📉 This indicator uses five EMAs from various time frames to show clear alignment or disparity across time frames, which helps determine strong market trends.
– 🎨 A visual ribbon overlay on the price chart indicates trend direction; green signifies an uptrend, while purple indicates a downtrend.
– ❌ Mixed colors or when the price is inside the ribbon usually suggest market consolidation or pullbacks, which are risky for trading.
– ⚖️ The indicator is meant as a trend confirmation tool and is best paired with other entry/exit indicators like RSI or MACD for accurate trade setups.
– 📈 For buy trades, the approach involves waiting for a green trend ribbon, then using RSI signals for entry points.
– 📉 Drawing parallels for sell trades, a fully purple ribbon and RSI movements are used as confirmation for selling positions.
– ⌛ Patience and alignment across indicators are emphasized for making reliable trading decisions, with additional tools like ADX suggested for confirming market volatility.
Good Trading!
Guy