These video will get you started on understanding how to use candlestick patterns for trading and investing. A candlestick chart (also called Japanese candlestick chart) is a style of financial chart used to describe price movements of a security, derivative, or currency. Each “candlestick” typically shows one day, thus a one-month chart may show the 20 trading days as 20 candlesticks according to Wikipedia.
This first video covers the basics of candlesticks.
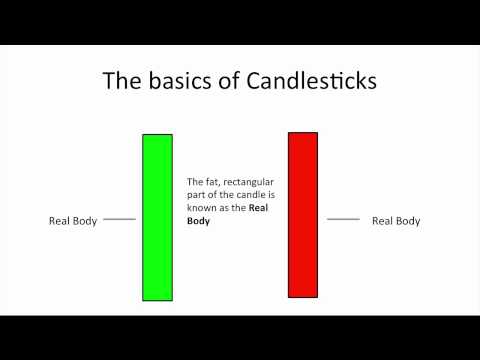
The video is a beginners guide to candlestick patterns.
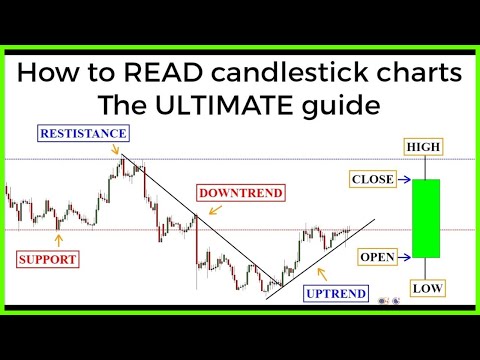
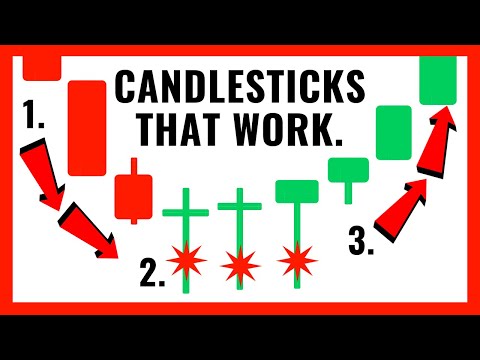
The next videos talks about certain candlestick patterns you need to be aware of.
Trading Resources for Today
Special Offer – Free 30day Trial to MarketClub
Click here and use the promo code “FRIENDS FREE”!