This video is about the PVT indicator – a tool for spotting when the new trends. They will show you exactly how this underrated tool works, why it’s smarter than old-school volume indicators, and most importantly – how to use it without getting fooled by fake outs. Now for me I would not just use this alone but with other indicators which I will share be sharing on another post.

My PVT “Aha!” Moment (And Faceplant)
Let me paint you a picture. There I was, staring at Apple’s chart—price climbing, PVT indicator soaring—“This is it!” I went all in. Then? The volume evaporated like my motivation on a Monday morning. PVT nosedived. I lost $1,200 faster than you can say “stop-loss.” Lesson learned: PVT doesn’t lie… if you know how to read it.
What Is PVT? (And the Genius Behind It)
The OG: Joseph Granville’s OBV (1963)
Before PVT, there was On-Balance Volume (OBV)—invented by Joseph Granville, the rockstar technical analyst. OBV was revolutionary because it tied price and volume together for the first time.
How it worked:
- If today’s close > yesterday’s: Add volume
-
If today’s close < yesterday’s: Subtract volume
The problem? OBV treated every price move the same—whether a stock moved 0.1% or 10%. That’s like weighing a grape and a watermelon on the same scale.
Enter Lance Beggs: The Man Who Fixed OBV
Lance Beggs (trader and educator) looked at OBV and thought: “Why give equal weight to tiny moves and massive spikes?” So he created PVT (Price Volume Trend) with two key upgrades:
- Uses percentage price changes (not raw numbers)
- More sensitive to real momentum shifts
Example:
- Stock rises 0.5% on 1M volume → PVT adds 5,000 units
- Stock rises 5% on 1M volume → PVT adds 50,000 units
(OBV would’ve added 1M to both—nonsense!)
PVT vs. OBV: Why Traders Switched
| OBV Flaws | PVT Fixes |
|---|---|
| Treats all price moves equally | Weights moves by % impact |
| Whipsaws in choppy markets | Smoother, fewer fakeouts |
| Misses subtle accumulation | Catches “smart money” earlier |
Lance’s mic drop: “Volume should reflect the significance of the price move.”
The New Kid: PCVT (Everget’s Turbocharged PVT)
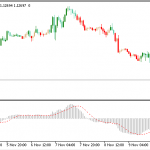
Fast-forward to TradingView’s Everget, who said: “PVT’s great, but let’s smooth out the noise.” Enter PCVT:
- Even cleaner signals (better for day trading)
-
Customizable lookback periods
PVT → PCVT = Like upgrading from a flip phone to a smartphone
So to add the Everget PCV to your chart just log in to TradingView.com click on indicators and look for: Price Volume Trend be “everget” and click on it. That’s all you have to do.. Once installed you can fiddle around with the settings and the colors if you like.
How to Actually Use PVT/PCVT (Without the Heartburn)
1. Trend Confirmation: The Only Signal I Trust
- Bullish: Price ↗ + PVT ↗ + Volume ↗ = “This trend has legs.”
-
Bearish: Price ↘ + PVT ↘ + Volume ↗ = “Get out while you can.”
Pro Tip: If PVT and price disagree, walk away. (Learned this the hard way with Bitcoin.)
2. Divergence: The Sneaky Reversal Signal
- Bearish Divergence: Price hits new high, PVT says “nah” (lower high) → Sell.
-
Bullish Divergence: Price tanks, PVT holds steady → Buy.
(Example: NVDA rallied 20% last month—PVT warned of a pullback 2 days early.)
3. Breakouts: The “Fool Me Once” Rule
- Valid Breakout: Price breaks resistance ↗ + PVT spikes ↗ + Volume 2× average.
-
Fakeout: Price breaks ↗ but PVT yawns → Trap!
PVT’s Dirty Little Secrets
- It lags. Fix? Pair with RSI or MACD for early hints.
- Volume gaps break it. Useless in forex/low-volume crypto
-
Default settings suck. Tweak it: 10-period MA smooths the drama.
My Go-To PVT/PCVT Combos
| Strategy | Indicators | Best For |
|---|---|---|
| Swing Trade | PVT + 50 EMA | Stocks |
| Day Trade | PCVT + VWAP | Crypto |
| Divergence Play | PVT + MACD | Reversals |
Final Tip (From My Blunder Log)
PVT’s like a lie detector—useless if you ignore it. Always check:
- Volume (real moves need real money).
-
Price action (support/resistance).
Good Trading!
Guy