This is interesting… Has some potential BUT I think it needs to be modified. Have been playing around with this strategy but there are to many losses in sideways markets. Will see if I can come up with my own rules.

– 📈 Introduction of a trend indicator: The video introduces a trend indicator on TradingView called the logarithmic regression channel trend indicator, designed to capture actual trends by smoothing out price movements.
– 🟢 Color-coded signals: The indicator features a regression line with color shifts (green for bullish and red for bearish) based on crossover logic, providing confirmation for market trends.
– 📊 Logarithmic regression channel: This channel serves as a longer-term guide with color-coded bands indicating uptrends and downtrends, helping identify overbought or oversold conditions.
– 🛠️ Strategy outline: The strategy suggests using the channel to determine trade direction, with the ribbon indicating pullbacks and continuations, combined with an additional indicator to prevent false signals.
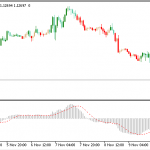
– 📉 Andian oscillator: This complementary indicator helps filter out flat market conditions, using line placement to confirm upward or downward market pressure.
– ✅ Buy trade setup: Demonstrates a buy trade setup using the green channel, red-to-green ribbon signal, Andian oscillator confirmation, and strategies for stop loss and take profit.
– 🟠 Sell trade setup: Illustrates a sell trade setup with a red channel, green-to-red ribbon signal, and confirmation from the Andian oscillator, along with stop loss and take profit guidelines.
– 🔄 Multi-layer confirmation: The strategy emphasizes using multi-layer confirmation to align with trends, avoid choppy markets, and reduce uncertainty, while acknowledging that no strategy is infallible.