

This video explains the theory of Bollinger Bands and some chart examples. Bollinger Bands are a type of statistical chart characterizing the prices and volatility over time using a formulaic
Day: July 20, 2022
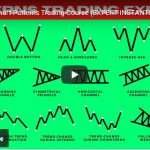
What Are The Best Chart Patterns?What Are The Best Chart Patterns?
This video explains the best chart patterns for trading the markets. Chart patterns are one of the basics of technical analysis. Chart patterns appear on all timeframes from one