This is a video of John Murphy’s presentation at ChartCon 2011.
Good Trading and Investing!
Guy
John Murphy

This is a video of John Murphy’s presentation at ChartCon 2011.
Good Trading and Investing!
Guy
John Murphy
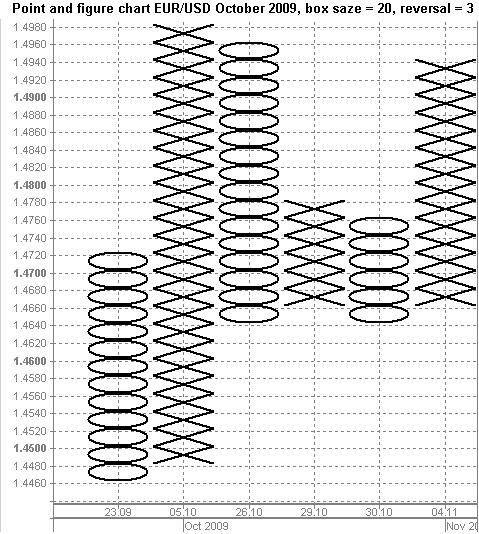
Here is an interesting video al all about point and figure charts. Related posts: How To Use The RSI Technical Analysis Indicator Very Interesting Scalping Trading Strategy Interviewing
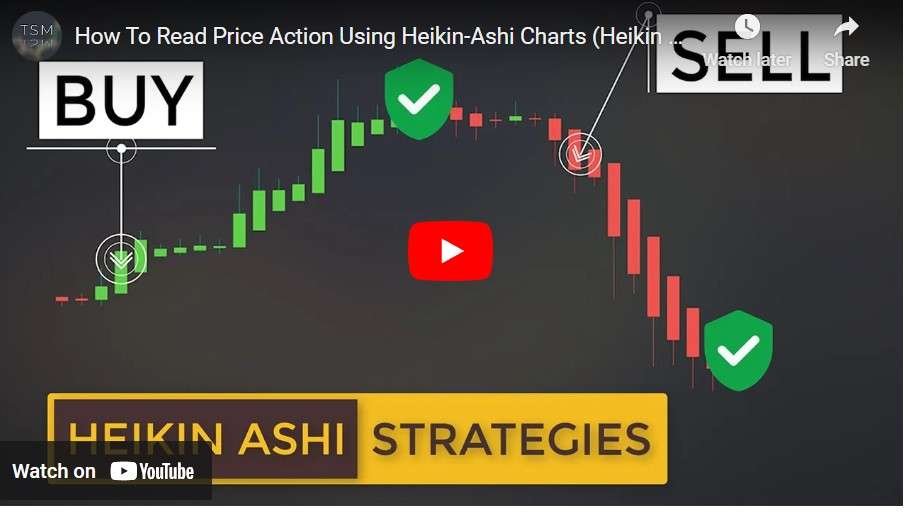
Heikin-Ashi charts, bless their souls, are a kind of candlestick chart used in the art of technical analysis to divine the trends of the market and forecast its future movements.