I’ve been dabbling in trading for a while, and if there’s one thing I’ve learned, it’s that my charts can turn into a chaotic mess faster than you can say “technical analysis.” Too many lines, squiggles, and indicators—sound familiar? That’s why I was hooked from the first second of this
It’s a quick, no-nonsense take on why less is more when it comes to trading success. Here’s what I took away—and why I’m rethinking my approach.
The Problem: Overloaded Charts, Overwhelmed Minds
Right out of the gate (at the 00:00 mark), the video nails a truth I’ve felt deep in my bones: a lot of us traders—newbies and vets alike—pile on too many tools. Moving averages, RSI, Bollinger Bands, MACD…
it’s like we’re building a fortress of data. But instead of clarity, it breeds confusion. By 00:14, the presenter drives it home: complexity kills decision-making. I’ve been there—staring at a chart, paralyzed because one indicator says “buy” while another screams “sell.” Sound familiar?
The Fix: Strip It Down to the Essentials
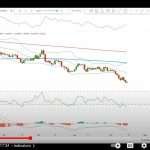
Here’s where it gets good. The video argues that trading success isn’t about having the most indicators—it’s about using the right ones simply. At 00:29, they suggest sticking to two key players: a trend measure and an overbought/oversold index.
Their picks? A 50-day moving average to gauge the trend (is the stock climbing or tanking?) and Williams %R to spot when it’s overstretched either way. I love this combo—it’s like a compass and a speedometer, giving you direction and timing without the clutter.
Then, at 00:42, they throw in a curveball: a seasonal tendency chart. This one’s new to me—basically, it shows whether a stock or commodity should be rallying based on historical patterns.
Think gold in winter or retail stocks before the holidays. It’s not foolproof, but it’s a clever way to tilt the odds in your favor.
Why It Resonates
What I dig most about this video is its vibe: practical, not preachy. It’s not shilling some fancy system or promising overnight riches. It’s just saying, “Hey, cut the noise and focus.” I’ve been guilty of overcomplicating my trades—adding indicators until I can’t see the price action anymore.
This feels like permission to breathe, to trust a few solid tools instead of chasing every shiny new oscillator.
My Next Move
After watching, I’m itching to declutter my charts. Step one: pare it down to that 50-day moving average and Williams %R. Step two: dig into seasonal tendencies for the stocks I’m eyeing—maybe there’s a pattern I’ve been missing.
I’ll test this lean setup on a paper trade first (no sense risking real cash until I’m sold). If it keeps my head clear and my decisions sharp, I might just have a new go-to strategy.
Have you tried simplifying your trading setup? Or caught this video yourself? Drop a comment—I’d love to swap notes!
Good Trading!
Guy