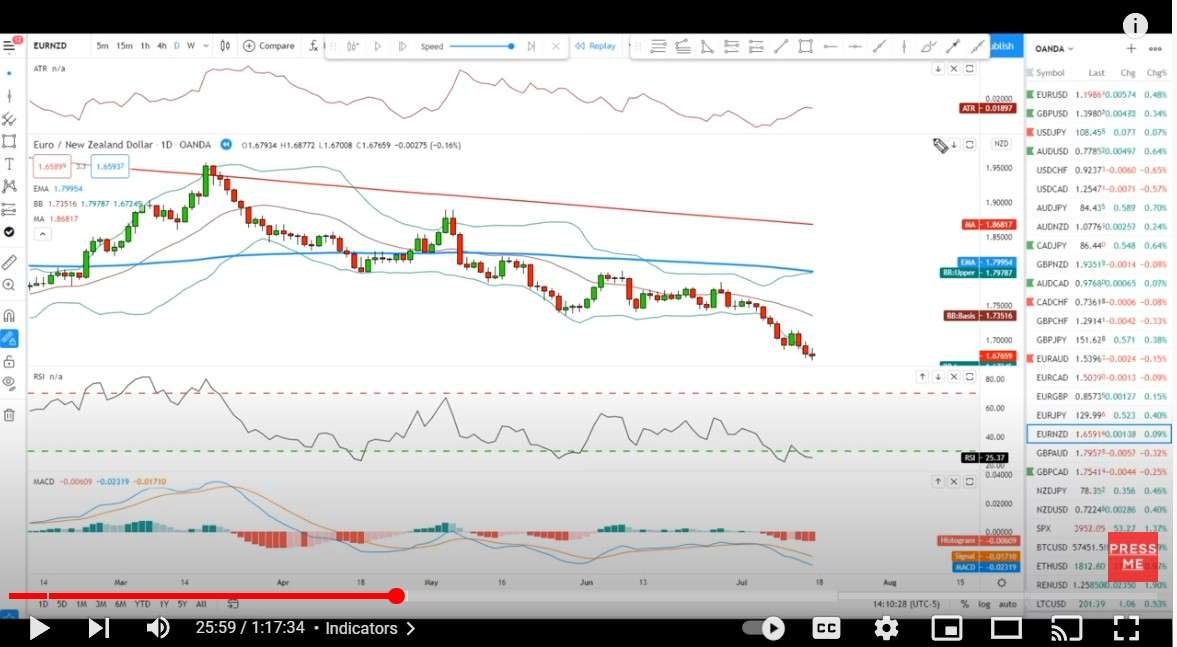
This video explains the theory of Bollinger Bands and some chart examples. Bollinger Bands are a type of statistical chart characterizing the prices and volatility over time using a formulaic method created by John Bollinger in the 1980s.

This video explains the theory of Bollinger Bands and some chart examples. Bollinger Bands are a type of statistical chart characterizing the prices and volatility over time using a formulaic method created by John Bollinger in the 1980s.

Traders have been using chart patterns since trading began to help give them a clue to the direction of the markets, up, down or sideways. There are both advantages and
Video from the Trading Channel. According to them: ” Understanding how to implement technical analysis correctly in your trading is one of the most important things you need to create