In this video you will have a peek at how to get started with technical analysis.

In this video you will have a peek at how to get started with technical analysis.

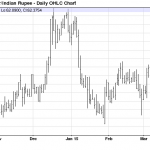
This video explains a simple for using Heiken-Ashi charts to smooth out price actions. “Heikin-Ashi is a Japanese trading indicator that means “average pace”. Heikin-Ashi charts resemble candlestick charts, but

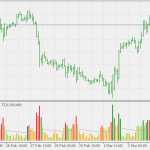
This video explains how to use the RSI divergence trading strategy. Divergence is when the price and your indicator are moving in different directions. Related posts: 5 Top Technical