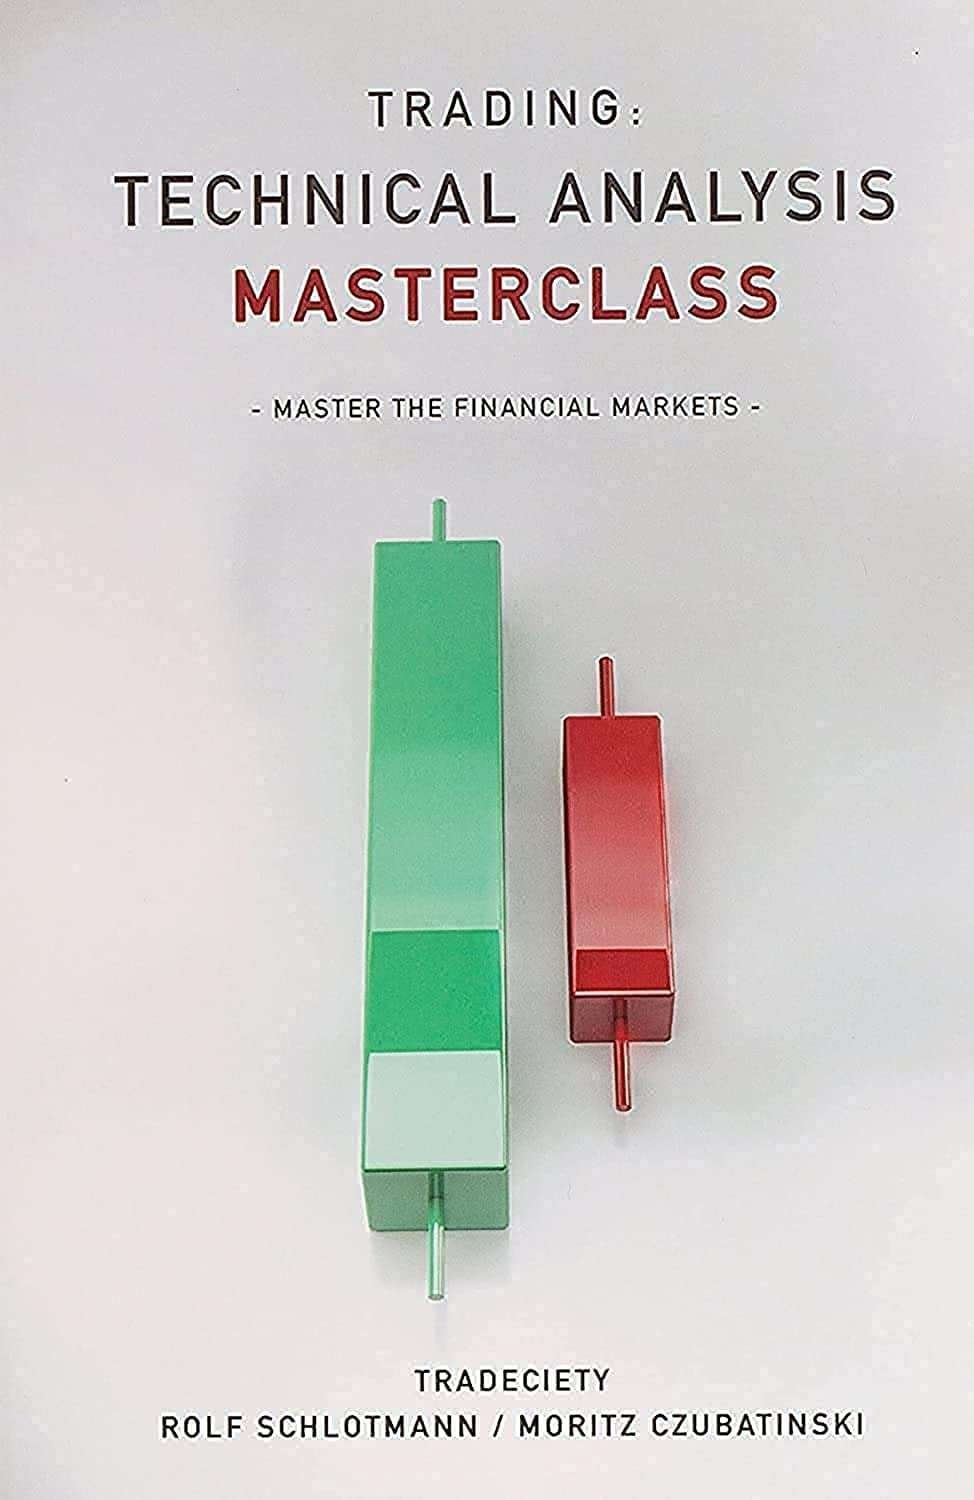
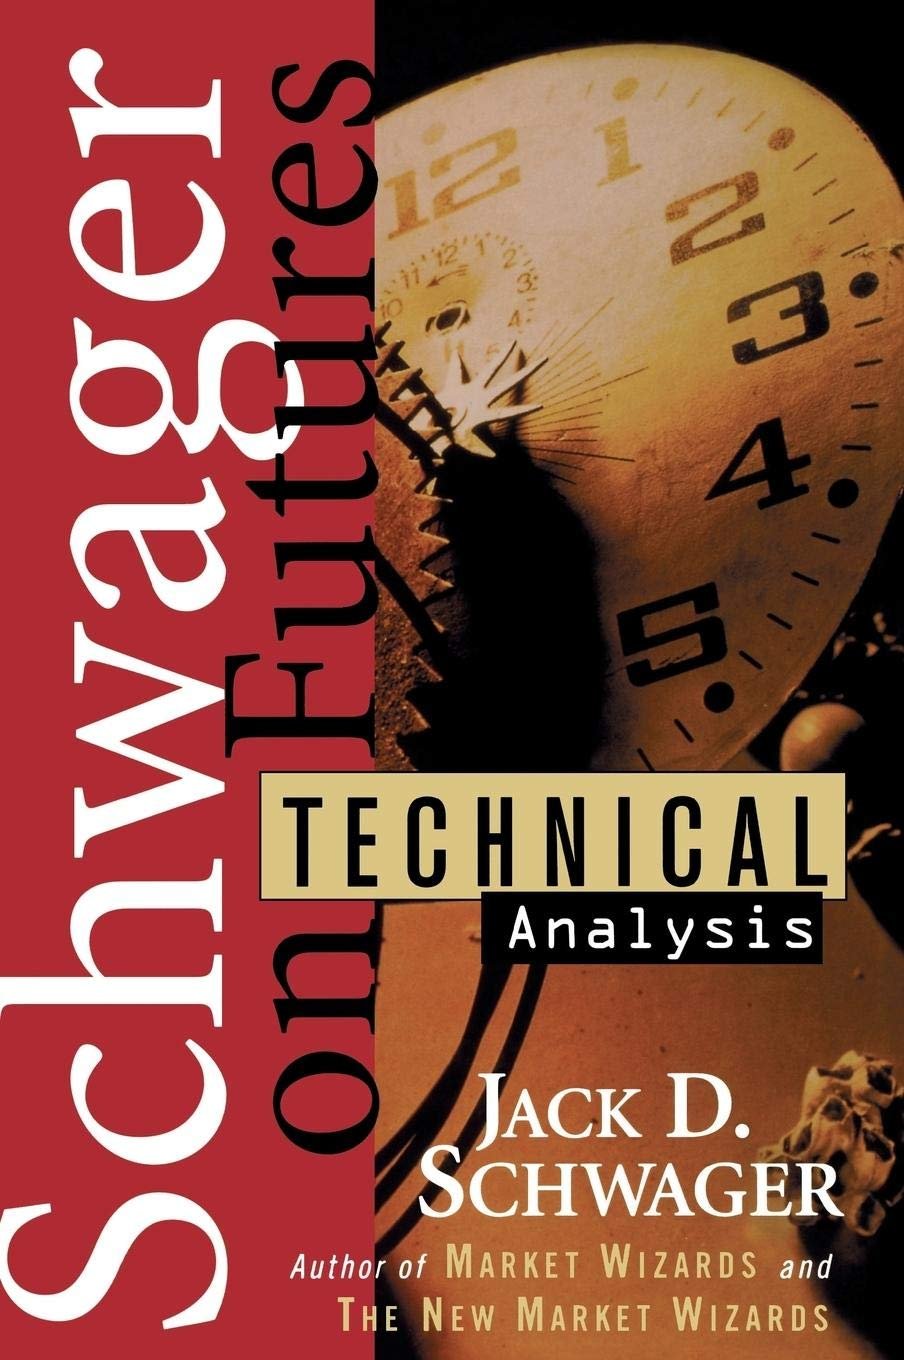
You know, when I first heard about The Investor’s Guide to Technical Analysis, I thought, “Well, that sounds like a manual for decoding Wall Street’s secret handshake.” And, honestly, it kind of is. This book steps up as a guide for anyone wanting to get familiar with the twists and turns of the stock market—without feeling like you’re lost in a maze of charts and jargon.
Key Features
Now, the book leans on the idea that education should be accessible—no matter where you start. With over a century of experience behind it, this guide promises a steady, reliable approach to technical analysis. It breaks down complex concepts like moving averages, trend lines, and market indicators into something a bit more digestible—sort of like having a coach showing you the ropes, rather than handing you a 400-page textbook.
What’s helpful is how it’s designed to meet the needs of both beginners and folks who have a bit of a footing already. For example, it doesn’t just throw charts at you; it explains why those charts matter and how they can actually help you make better decisions when buying or selling stocks. Plus, it tries to keep the tone steady and clear, without getting too lofty or intimidating—which is a relief if you’re not a finance major.
Unlock Your Investment Potential
Pros & Cons
On the positive side, many readers found it well-structured and appreciated its educational tone. If you’re just dipping your toes into investing, it’s a decent compass to help you understand technical analysis basics. One happy reviewer mentioned it was “clear and straightforward,” which is exactly what you want when you’re trying to figure out what those squiggly lines mean.
But, on the flip side—because there’s always one—the book’s rating sits at about 3.7 stars. Some readers felt it didn’t go deep enough or that it skimmed over some of the tougher concepts without fully clarifying them. So, if you’re a seasoned trader expecting advanced strategies, this might come off as a bit on the light side. A few users also wished for more real-world examples or case studies, which could have made the lessons stick better.
Who Is It For?
In plain terms, The Investor’s Guide to Technical Analysis is tailor-made for beginners or intermediate investors who want to get a grasp on how to read market movements without getting overwhelmed. It’s for the person who’s curious about stocks, maybe has heard talk of “bulls and bears” and wants to make sense of that, but doesn’t have hours to spend decoding financial jargon. It works well as a stepping stone—helping you build confidence before exploring more complex investment strategies.
Final Thoughts
So, what’s the verdict? If you’re new to technical analysis and want a solid, no-nonsense introduction, this guide might just be your friend. It’s like having a patient professor walking you through the basics, minus the lecture hall anxiety. Of course, if you’re looking for a deep dive, you might find yourself needing a second book down the line. But as a starting point? For $16, it’s a modest investment toward demystifying the markets.
In the end, The Investor’s Guide to Technical Analysis keeps it reasonably simple, educational, and accessible—whether you’re an aspiring investor or just someone who wants to understand what all those market charts really are trying to say. And isn’t that just what education ought to be?
As an Amazon Associate, I earn from qualifying purchases.
If you are looking for more information on technical analysis, trading advisories, brokers. trading platforms, trading systems, copy trading and more please visit our resources page:


