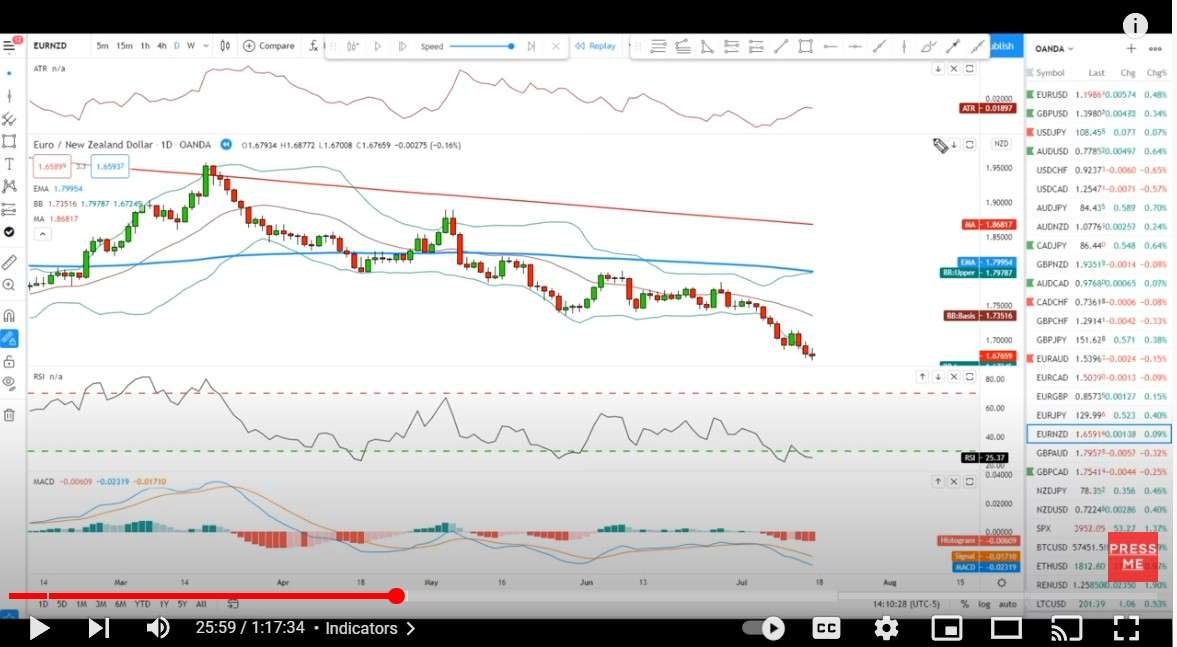
If you want to learn how to swing trading this video will get you on the right track.
If you want to learn how to swing trading this video will get you on the right track.

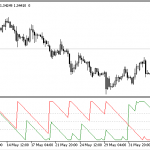
This is a scalping indicator that can be found on TradingView. It claims a 96.8% win rate. but I am skeptical of that. I do like the way he explains
Video from the Trading Channel. According to them: ” Understanding how to implement technical analysis correctly in your trading is one of the most important things you need to create