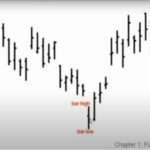
Here is an interesting video al all about point and figure charts.
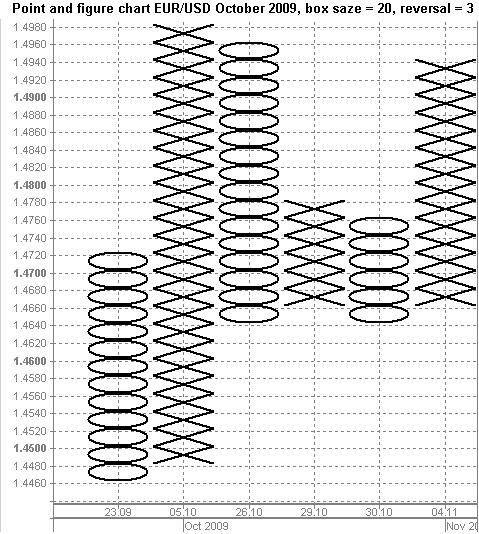
Here is an interesting video al all about point and figure charts.

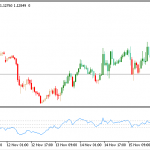
This video explains one method for how to use the ADX- Average Directional Movement Indicator indicator. It is designed to quantify trend strength by measuring the amount of price movement
Heikin-Ashi charts, bless their souls, are a kind of candlestick chart used in the art of technical analysis to divine the trends of the market and forecast its future movements.